Why Team Onboarding Matters
Effective onboarding ensures your team:- Quickly understands how to navigate and contribute within Vistaly
- Experience immediate value through relevant business context
- Establishes a shared language for discussing strategy and discovery
- Builds momentum through visible collaboration
Understanding User Roles
Vistaly offers two primary user types, each with distinct permissions:| User Type | Capabilities | Best For |
|---|---|---|
| Editors |
|
|
| Viewers (Collaborators) |
|
|
Preparing for Team Onboarding
1. Build a Foundation with Real Data
You’ll see Vistaly’s full value when you populate it with your actual business context. Before inviting team members, prepare a minimal but meaningful workspace:Create a Minimal KPI Tree:
- Identify 2-3 business metrics relevant to your team’s work
- Add these to the top of your workspace
- Include at least two levels above where your team typically works
- Don’t worry about perfection—position it as a starting point for discussion
Add One Outcome:
- Connect one outcome to a leaf KPI
- Choose something familiar to your team’s current focus
- If possible, add historic data points to demonstrate impact tracking

Add Opportunities with Insights:
- Import recent customer feedback or research insights
- Connect these insights to specific opportunities
- Apply rough sizing to opportunities (but toggle this off initially to avoid overwhelming new users)
Add Solutions and Statuses:
- Create a few solution ideas for high-value opportunities
- Update statuses to either “Now” or “Next” for prioritized items
- Leave some as ideas to demonstrate the full workflow
Solutions & Statuses
Now add a few solution ideas to one or two high-value opportunities. Then update the statuses to either Now or Next. Keep a few as ideas.2. Create a Now/Next Filter
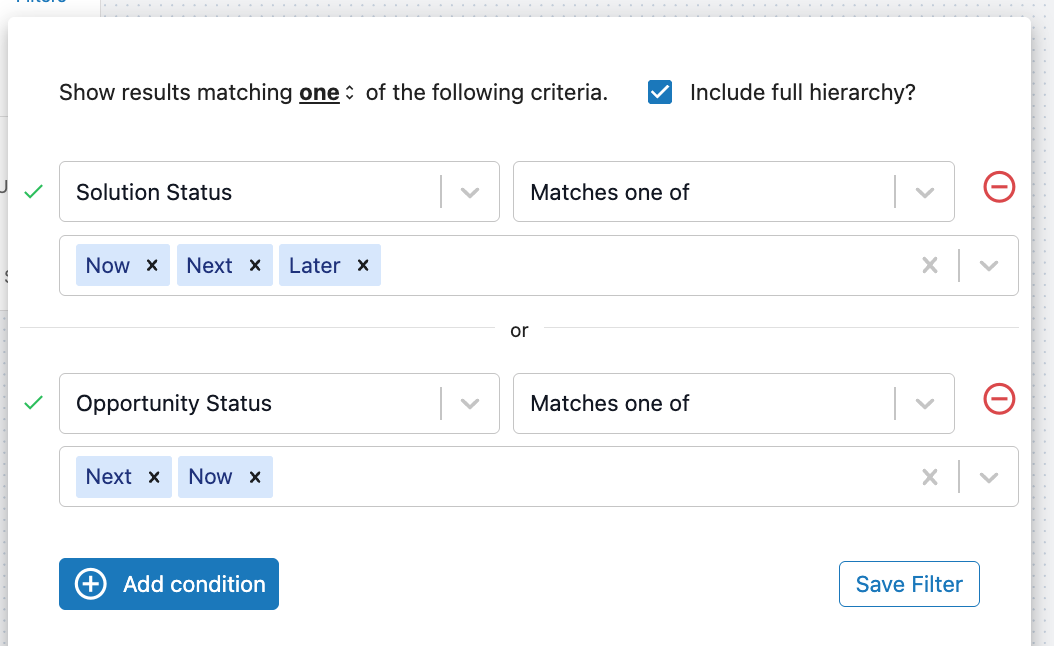
Filters are flexible, one of the most commonly created filters is the Now/Next Filter. It show which opportunities and solutions are prioritized in the tree view, and removes all the clutter creating a roadmap view that shows “The Story” behind each prioritized solution.- Open the filter menu and select “Add Condition”

- Add the following filter conditions:
- Solution Status | “Matches one of” | Now & Next
- Opportunity Status | “Matches one of” | Now & Next

- Select “Include full hierarchy” to show all ancestor cards
- Save the filter to make it available to all users
Running Effective Onboarding Sessions
Choose the Right Starting Point
The best entry point depends on your audience:- For product team members: Start with the tree view
- For executives or stakeholders: Begin with a populated reporting view
Tree Walkthrough Best Practices
- Use View Mode
- Activate view mode to hide “add” buttons and tighten the tree display
- This creates a cleaner, more scannable presentation
- Reveal One Level at a Time
- Start at the top or the highest relevant level for your audience
- Expand only one level at a time to prevent overwhelming new users
- Allow time for questions at each level
- Demonstrate the Now/Next Filter
- After walking through the full tree, apply the Now/Next filter
- Show how this creates a clean roadmap-like view of priorities
- Connect Insights to Opportunities
- Highlight how customer feedback connects directly to opportunities
- Show the “evidence trail” from insight to solution by selecting an opportunity with insights and opening the insight list.
Reports Walkthrough Best Practices
Build the right report for the right audience
- For product team members: Create a report with relevant KPI cards and the teams outcome. These metrics could include engagement metrics or other performance indicators related to the outcome.
- For executives or stakeholders: Create a report that showcases business impact. This means including higher-level business KPIs. Depending on the audience, it could be helpful to include all current outcomes.

