The Cost of Misalignment
Aligning everyone from the C-suite down to individual product managers on the strategy is one of the most important things you can do as a product leader. But it’s hard. And since it’s so hard, you’ve probably experience some of these symptoms yourself:- Disconnected Feature Roadmaps: Your product backlog feels like a grab bag of “cool ideas” rather than a coherent path to solve a user’s pressing problem or drive measurable business outcomes.
- Perpetual Fire Drills: The product team experiences whiplash from last minute feature requests to “close a big deal”, or “must-have” features from executives.
- Conflicting Metrics and Goals: Marketing is aiming to double the number of free-trial signups, but the product team is focusing on existing-user engagement. Meanwhile, the CFO is pushing for cost efficiency. You have multiple priorities that rarely align.
- Rising Churn or No Growth: You’re shipping new features, but adoption is low. Churn is creeping up. New customer counts are down. Revenue growth has stalled. Board members question your direction. The product org feels blindsided because they never had clarity on the how the business is doing and what levers drive growth in the first place.
What You Need To Create Alignment
After working with hundreds of product teams, here are the four components of strategy that everyone needs to have in order to create alignment:A Vision for a Better Future
A good product strategy starts with a Vision or Mission for the change your company wants to create in the world.Clearly communicate who you’re building for and what a better future looks like for them.↓ Jump to Section
A "Value Exchange Model"
Board members and C-level leaders are focused on financial aspect of the business—things like top-line growth, retention, and gross margin.Meanwhile, product squads are more concerned with whether customers are getting real, repeatable value from the product—and how easy it is for them to actually tap into that value.The reality is that business metrics like revenue, retention, and top-line growth are downstream effects of customers getting real, repeated value from the product.They’re the final step of a chain reaction.If customers don’t set up your product, experience the value of using it for the first time, and continue to get the value by using it routinely, the business will struggle to grow revenue.A “Value Exchange Model” shows how well your business generates value for your customers, which in turn creates value for the business.↓ Jump to Section
A Clear Near-term Focus
If think of a Value Exchange Model as “the rules of the game and the current score” then your near-term focus is “what you want the score to be in the next few months or quarters.”They’re the goals, outcomes, or key results you want to achieve.Being specific about what areas of the business you’re focused on now will give you the courage to say “no” to distractions that fall outside of that focus.↓ Jump to Section
A Shared Workspace to Connect the Dots
It’s all too common for companies to have this strategic context living in way too many places: slides, spreadsheets, Confluence docs, and BI and product analytics tools.It’s too fragmented for anyone to grok the full picture.You need a single, shared workspace that connects the dots between the vision, the value exchange model, and the near-term focus.↓ Jump to Section
1. A Vision For A Better Future
At their core, vision and mission statements articulate how your product or company will make a difference for customers and the world. It paints a picture of a future state where your users are better off because of your product. In essence, a good vision/mission captures the why behind your work: the ultimate purpose and impact you aspire to achieve beyond day-to-day features or quarterly targets. Here are some common pitfalls to avoid when crafting your vision/mission statement:- Meaningless Fluff - One mistake is crafting a vision so broad that it says nothing meaningful. Statements like “be the leading provider of innovative solutions” could mean anything. Use plain language that contains enough specificity to inform decisions.
- Not Customer-Centric - Your vision shouldn’t be about your revenue goals, market share, or feature set. It should flip the perspective to the customer’s benefit (e.g. “simplify group travel” rather than “grow our platform”).
- Not Inspiring - Missions that are dry or purely intellectual often fail to stick. Emotion and boldness are not just nice-to-haves – they are essential. So to make your vision aspirational enough to be a bit scary – if no one rolls their eyes at how ambitious it sounds, maybe it’s not ambitious enough.
Example
Acme HealthWe will create a world where everyone has access to personalized healthcare that prevents illness before it occurs. We will revolutionize healthcare delivery through AI-powered predictive action that enables proactive, personalized care for all.In this example:
- The organization exists to provide personalized healthcare that knows you and is able to prevent illness before it occurs. This is the foundational purpose of this company, and it positions itself against the status quo.
- They take a stance on how they will achieve this vision through AI-powered predictive action. This acts as the guiding policy.
How To Do This In Vistaly
Create a Vision or Mission card to represent the enduring organizational direction. They are the stable, overarching purpose that guides all work.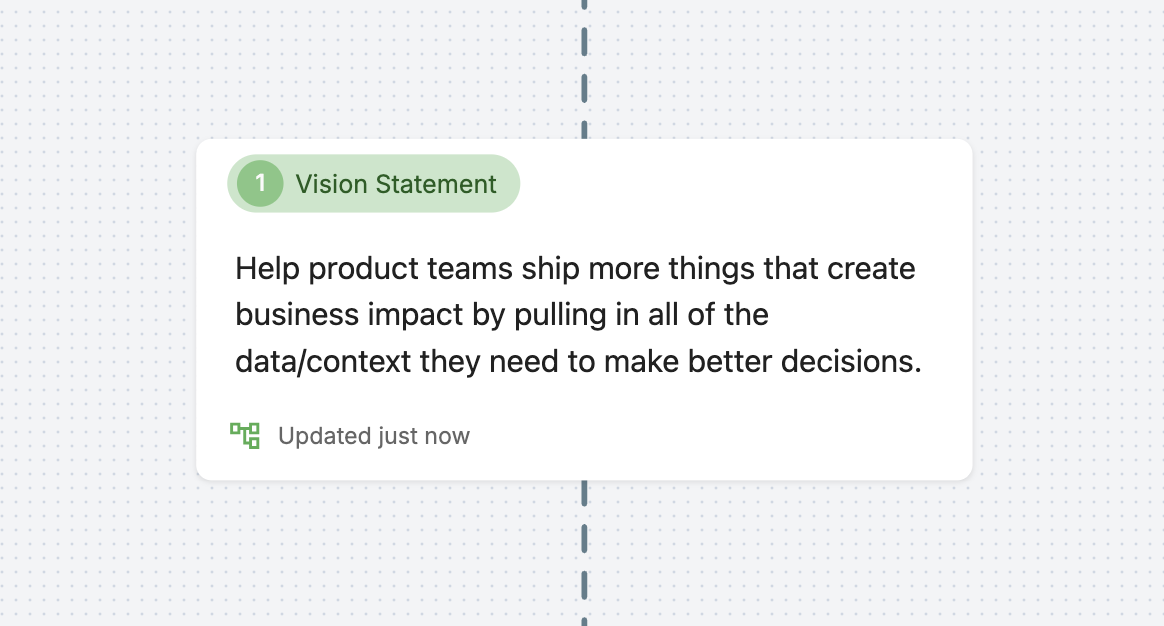
- Vision (Default in Vistaly)
- Mission Statement
- Strategic Pillar
By default, the Vision/Mission Card is disabled, this keeps getting started simple. As you begin to use Vistaly across the organization, enable this card type in Card Settings.
2. A Value Exchange Model
Most product managers have an intuitive but vague sense that if their team delivers value to customers, the business will benefit. That simply doesn’t cut it. This is why we see so many product squads focused on their little area of the product. A Value Exchange Model explicitly maps how your business makes money, the value customers get from using your product that drives revenue growth, and how easy/difficult it is for customer to realize that value. It turns gut feeling into a shared, visual representation that everyone can understand.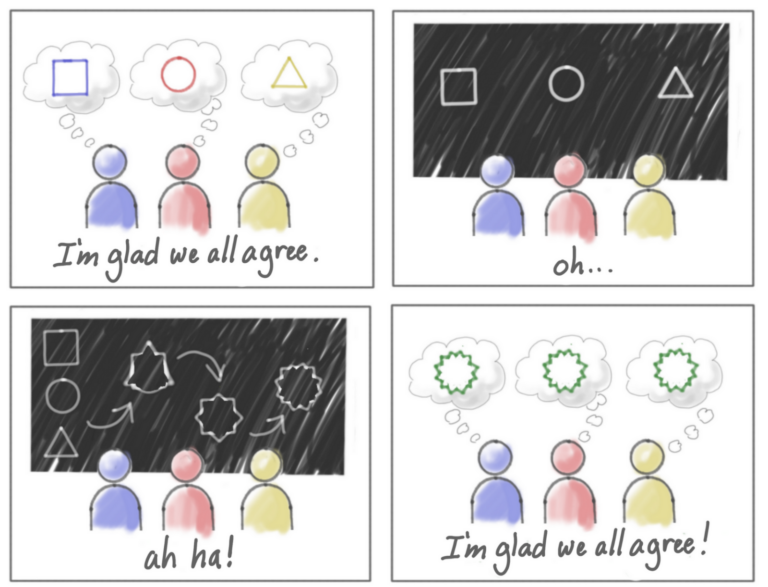
Start With An Assessment Of How The Business Is Currently Doing
The reality is that your business must reach or maintain certain financial milestones to keep operating. A good product strategy confronts these realities head-on. How are lagging business metrics (like revenue, retention, or profit) trending? These lagging metrics don’t change overnight, but they show your baseline reality, and that reality is the important context that will shape your near-term strategy. When product strategy doesn’t explicitly connect to business performance, product teams often prioritize work that doesn’t actually move the needle.Modeling Business Metrics With A KPI Tree
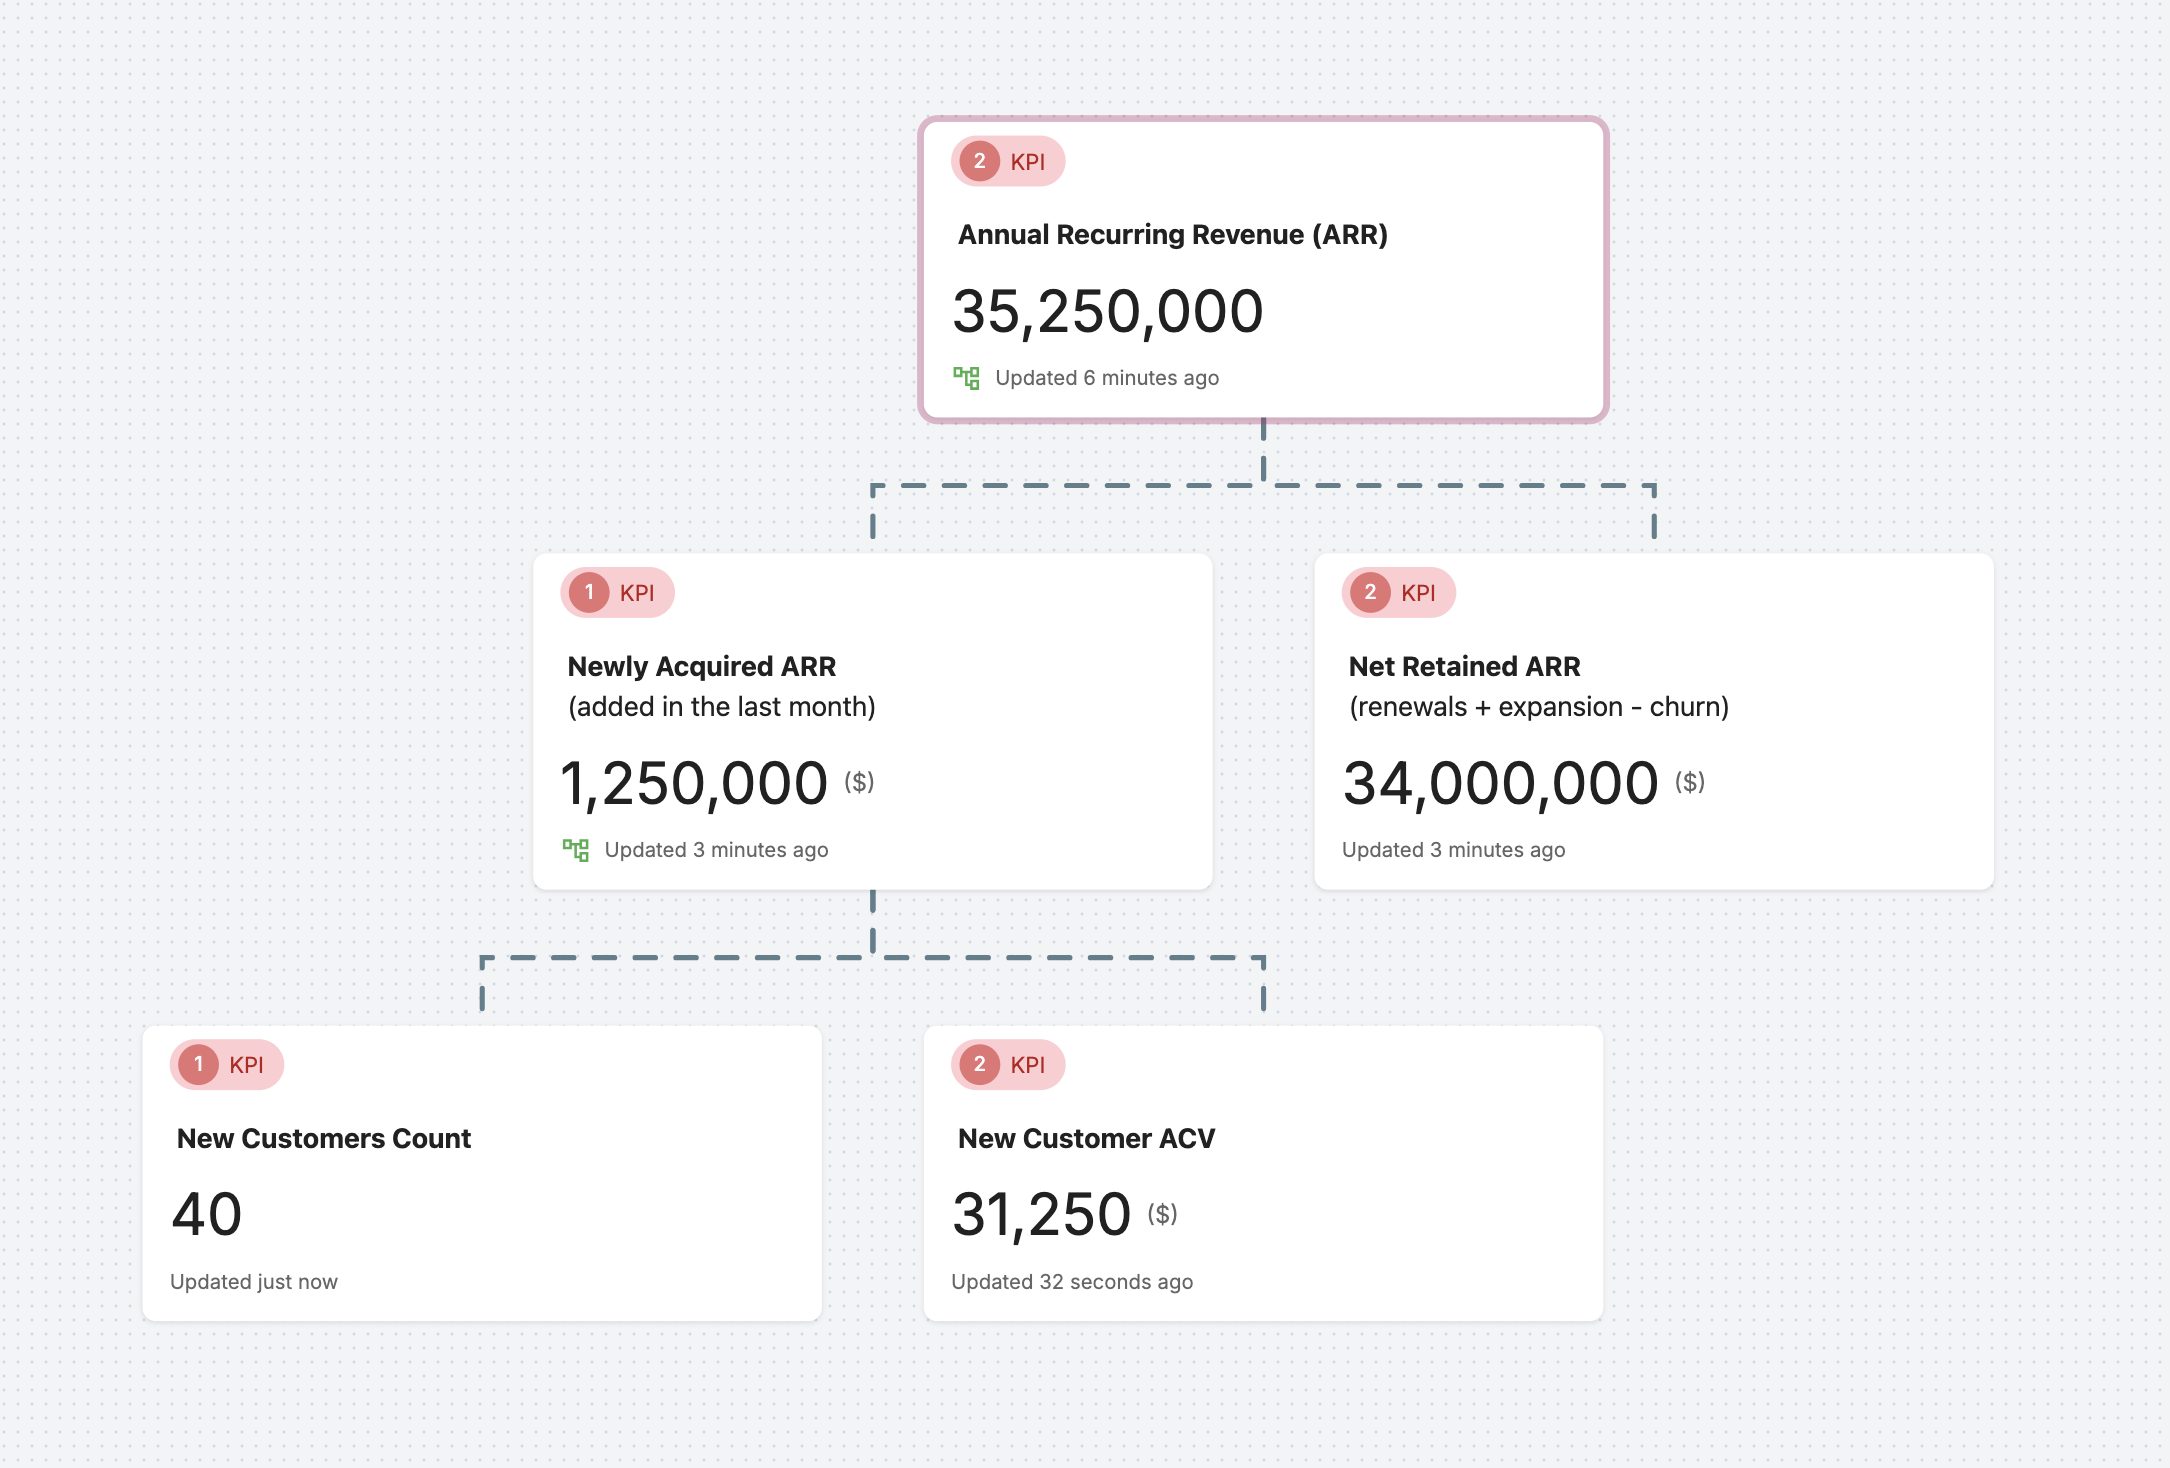
”KPI Trees” go by several names: Driver Tree, Impact Tree, Value Driver Tree, North Star Metrics (NSM) and more.
- Newly Acquired ARR
- Net Retained ARR
How To Do This In Vistaly
Use the KPI card type to track business or product metrics that remain relevant over extended periods of time (they are persistent).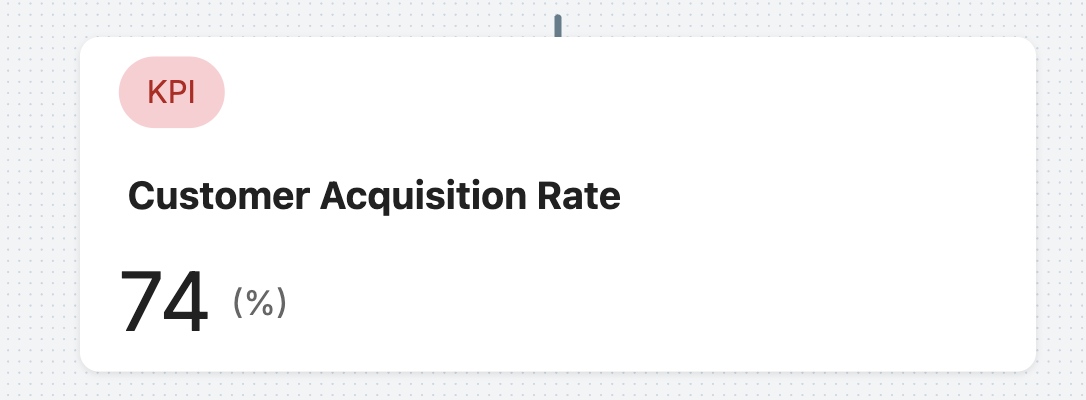
- Key Performance Indicator – KPI (Vistaly Default)
- Business Metric
- Health Metric
Examples
Annual Recurring Revenue (ARR)*- Description: Total value of recurring revenue normalized to an annual amount
- Formula: Monthly Recurring Revenue × 12
- Source: Hubspot
- Description: The percent of trials that purchase a subscription at the end of their trial
- Formula: New Paid Subscriptions / Trials Started
- Source: Ampltitude
Layer In The Drivers Of Business Metrics
Once you have your business metrics modeled in a KPI tree, the natural next question is “how do we actually drive these metrics?” To understand this, we need to switch perspectives from what the business cares about (inside-out thinking) to what your customers care about (outside-in thinking).Inside-out vs Outside-in Thinking
I hate to break it to you, but no one wakes up in the morning and thinks “I really want to buy some enterprise software today.” They just don’t. People buy things to solve problems or meet needs. The thing they’re buying might just be one step in a long chain of steps that gets them to their ultimate goal. But fundamentally, they want to get something done, and they want to do it in the easiest way possible. In other words, the business metrics you care about are effectively a measure of whether your product is solving a painful problem for your customers better than their alternatives.Product Metrics As Proxies For Value
But measuring value customers get from your product directly is challenging:- Complex Journeys & Multiple Steps: Your user’s success in reaching their end goal (like increase sales, improve productivity) might depend on multiple tools, business processes, or broader market conditions.
- Data Access: Capturing “true ROI” may require data from the user’s internal systems (billing, analytics, etc.), which they’re unlikely to share with you.
- Lag Time: The best indicators of success (e.g., annual cost savings or increased sales) might only become clear months or even years down the road.
- Measure the time it takes to complete a specific task
- Ask users to rate how easy it was to complete a task
- Track how often users return to the product after their first use
Proxy Metrics Don’t Have A 1-to-1 Relationship With Business Metrics
There is a difference in how two business metrics relate to one another and how business metrics and product metrics relate to one another. The “business metrics” portion of your KPI tree will have more of an “algebraic” relationship. You can usually add, multiply, or divide the child KPIs get the value of the parent. E.g.New Customers x New Customer ACV = New ARRBut relationship between product metrics and business metrics in your KPI tree is more “correlative”. The product metrics are influencing the business metric, but they aren’t the same thing. For example, doubling the rate at which new trials complete onboarding will likely improve conversion rate, but it’s unlikely to exactly double it (correlation vs causation).
Strategies For Picking The Best Proxy Metrics
The best strategy for identifying the right proxy metrics will depend on the level of data sophistication in place - but each strategy contains similar threads. It comes down to understanding your users, putting yourself in their shoes, and understanding what motivates them in their journey from before they interact with your product, until after they reach their goal.Low Data Sophistication - Describe In Words A Seamless User Journey
If you are pre-product, or if your team hasn’t invested in proper instrumentation, you can still use qualitative directional descriptions of the key steps that need to be taken in order for a user to realize the value of your product. To use Vistaly as an example, this would be things like:- On the onboarding side:
- Users are able to easily map their strategy space
- Users invite their team to collaborate
- Users import product feedback and customer interviews to understand the problem space
- On the retention side:
- Customers use Vistaly to communicate product decisions with their team
- Customers use Vistaly to consolidate product feedback from sales/support/success teams
- Customer use Vistaly to communicate with leadership about how they’re progressing on their goals/OKRs
Medium Data Sophistication - Product Metrics That Line Up With The User Journey
Having a baseline ideal user journey is a great start, but the team might have differing opinions on how accurate each step in the journey translates to user value when there is no way to measure them. The next step is to identify actions that are measurable in-product. This will help to quantify how true accurate each of those steps are when it comes to capturing user value. To continue the Vistaly example, this could look like:- On the onboarding side:
- Users are able to easily map their strategy space
- Metric: percent of new signups that create 30+ cards
- Users invite their team to collaborate
- Metric: percent of accounts with 3+ team members
- Users import product feedback and customer interviews to understand the problem space
- Metric: percent of new signups that import 20+ feedback
- Metric: percent of new signups that add 5+ interviews
- Users are able to easily map their strategy space
- On the retention side:
- Customers use Vistaly to communicate product decisions with their team
- Metric: monthly unique Roadmap viewers per paid customer
- Customers use Vistaly to consolidate product feedback from sales/support/success teams
- Metric: percent of paid customers that have feedback created by 5+ users
- Customer use Vistaly to communicate with leadership about how they’re progressing on their OKRs
- Metric: percent of paid customers with 3+ Report viewers per month
- Customers use Vistaly to communicate product decisions with their team
High Data Sophistication - Linear Regression And Correlation Analysis
The holy grail of getting alignment on the best measures of customers easily and repeatedly realizing the value of your product is to use linear regression and correlation analysis. Correlation measures the strength and direction of a relationship between two variables, yielding a coefficient between -1 and 1. A value close to 1 indicates a strong positive relationship, -1 a strong negative relationship, and 0 no relationship. This analysis helps identify which features or user actions are associated with key outcomes, such as retention or conversion. Linear regression goes a step further by modeling the relationship between a dependent variable and one or more independent variables—e.g. Percent of Trialers That Use Feature A and Trial Conversion Rate—allowing for predictions and understanding of how changes in inputs affect outputs. This method is necessary for going from “everyone’s best guess” about which leading indicators to track, to forecasting exactly how changes to a given factor will impact business metrics. While correlation is useful for initial exploration to spot potential relationships, regression analysis provides deeper insights into causality and the magnitude of effects.How To Do This In Vistaly
Under your KPI cards for business metrics, you can add KPI cards to track the proxy product or value metrics that are the drivers of the business metrics.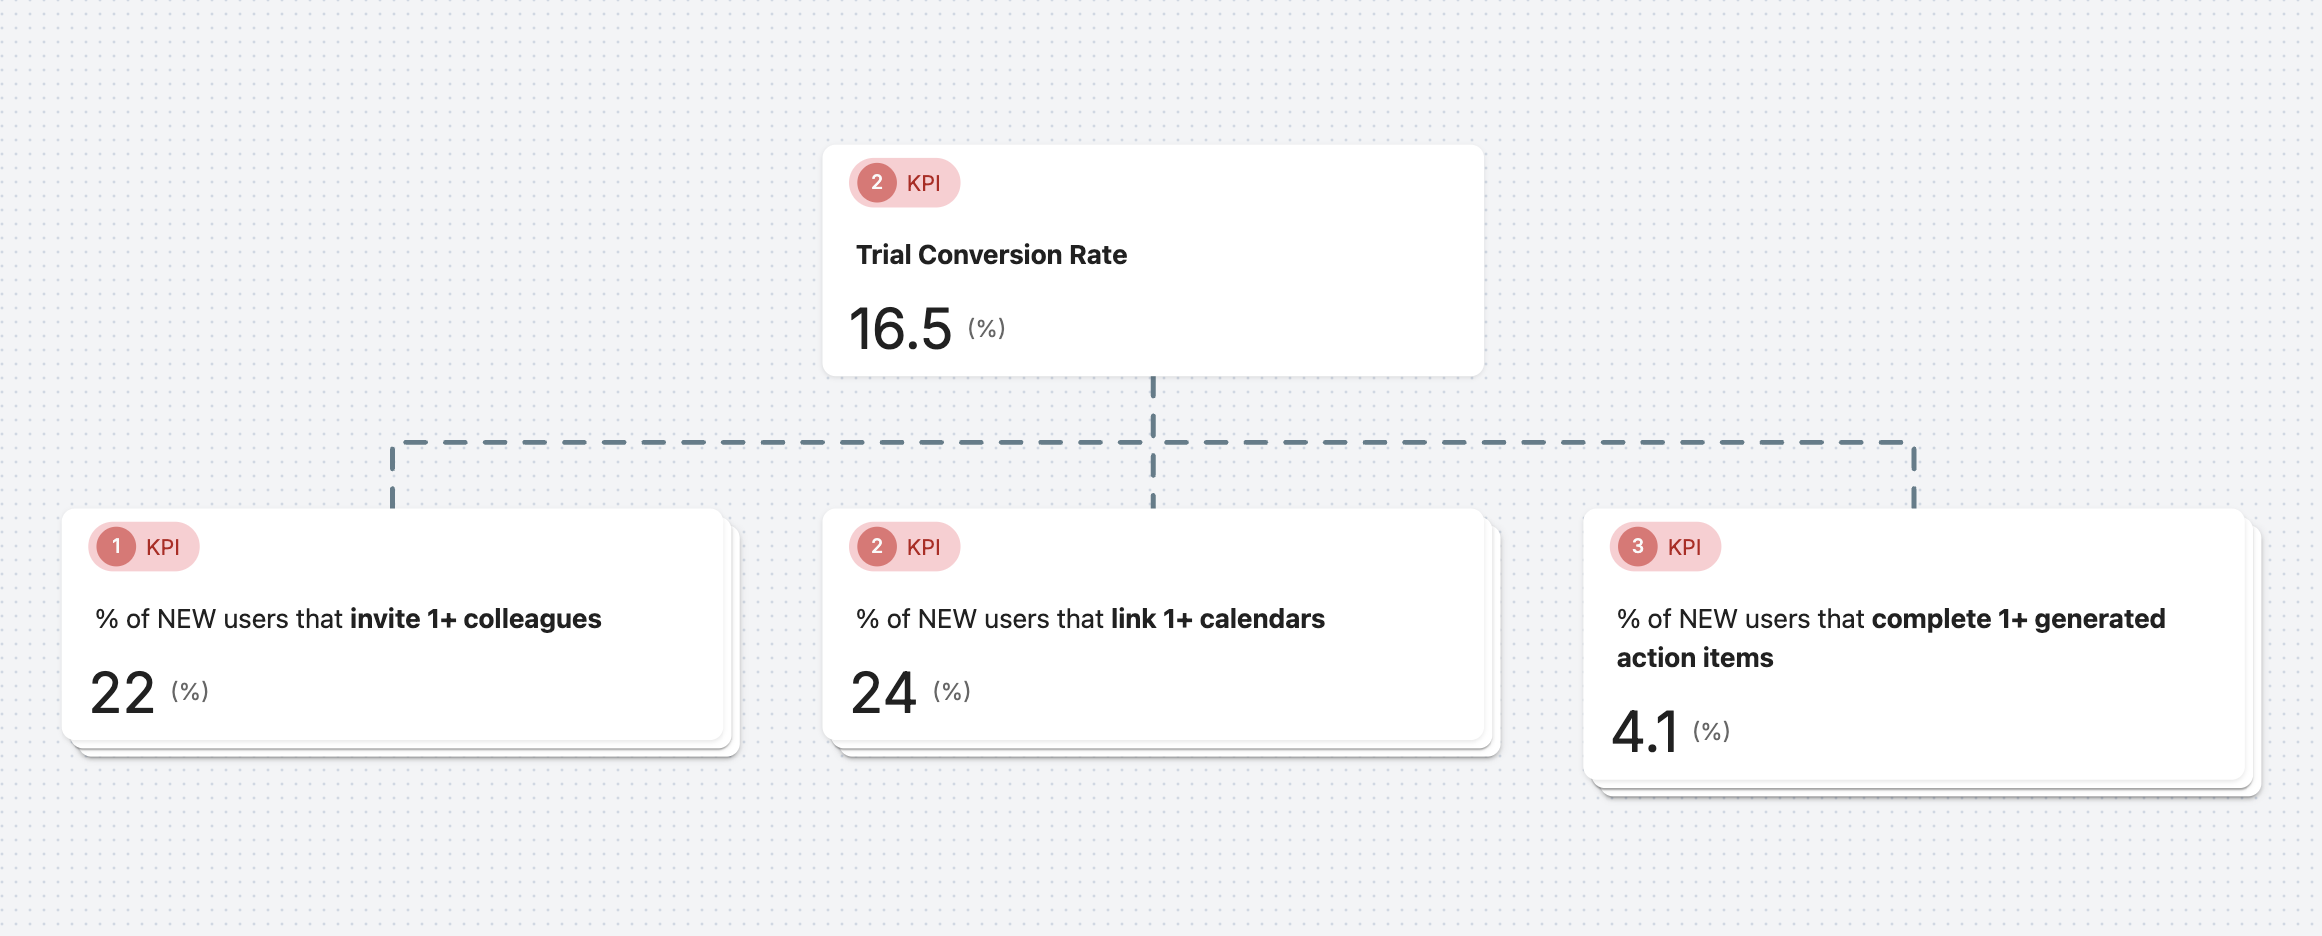
3. Pairing The Value Exchange Model With Near-term Focus
The Value Exchange Model connects business and product metrics and answers the question “How are we performing today?” How far are we on this journey to achieve our Vision? Your Near-term Focus answers the question “What are the most important areas of this to improve in the next one to two quarters?” When a clear near-term focus is missing, product teams easily get distracted by the latest shiny object or last-minute requests from sales or executives. Many teams use “Goals” to measure how well they are performing on their Near-term focus.What Makes For A Good Goal
Ideally, the goals you set for teams have three qualities:- Specific & Measurable - Clearly define exactly what the criteria are for hitting the goal. As Jeff Gothelf puts it, a good goal answers the question “Who, does what, by how much?”
- Time-bound - Work expands to fill the time alotted. So while you don’t have to have a hard cut-off date, a target deadline helps create urgency and focus.
- Never About Shipping Something - Goals to “ship” encourages feature factory thinking. You could ship all the new features in the world, but if no one uses them, it doesn’t matter.
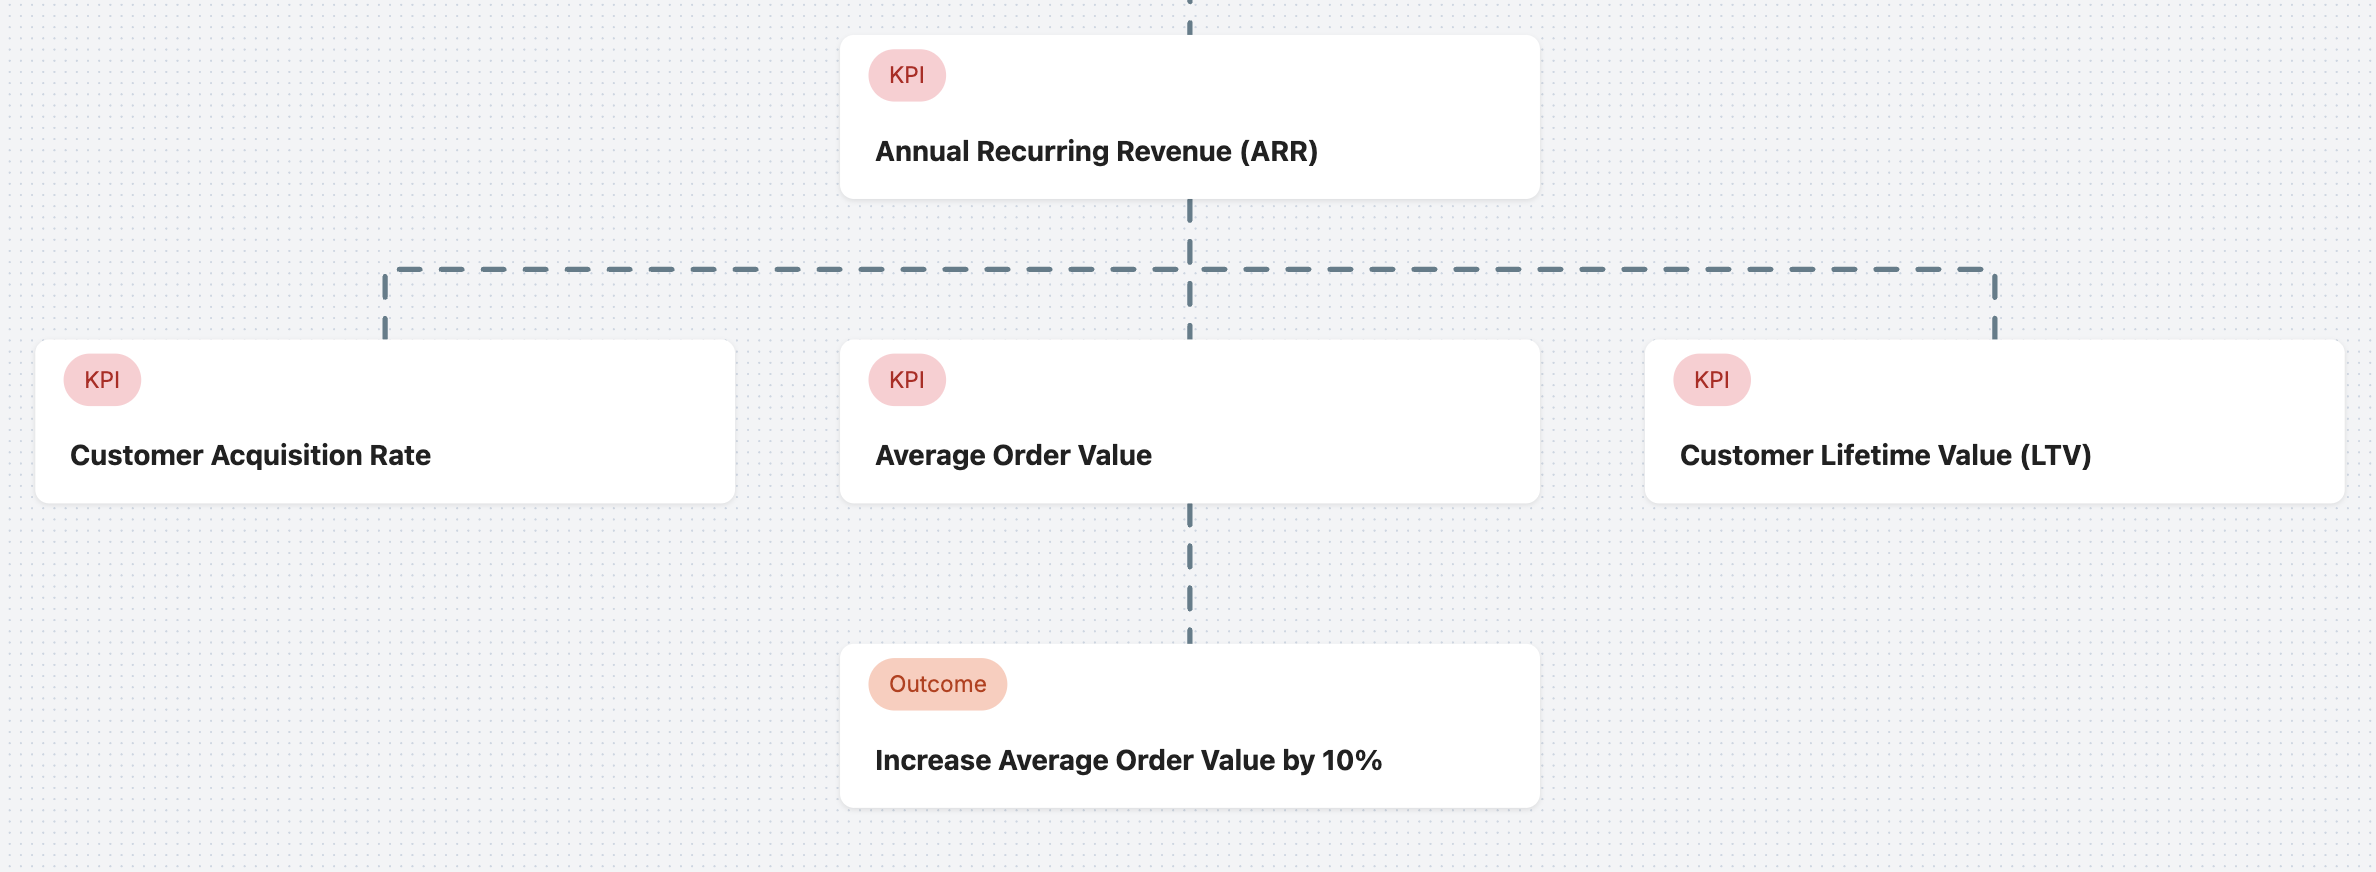
Don’t overload teams with goals
The point of setting goals is to create alignment and focus. As the saying goes, when everything is a priority, nothing is. We see this all the time with teams that are starting to adopt OKRs. Product squads will get assigned 5-6 key results and the dilution of focus means no single initiative gets sufficient attention to succeed. When working on too many goals in parallel, there’s a lot of activity but not much progress. Teams feel busy, but are spending too much time ramping up and down between goals (context switching).Working with Unmeasurable Goals
While measurable goals are ideal, you’ll often encounter situations where the metrics you want to track aren’t immediately available. This could be because:- The necessary data collection isn’t yet instrumented in your systems
- You’re exploring an entirely new product area with no existing measurement framework
- The goal involves qualitative changes that are difficult to quantify
- The real impact might only be visible over a longer timeframe than your planning horizon
Starting With Directional Goals
Directional goals describe the change you want to see, even when precise measurement isn’t yet possible. They:- Create alignment on intent and direction
- Acknowledge measurement challenges transparently
- Include plans for establishing measurement capability
Make it easier for customers integrate our product with their other tools:
- Initial proxy: Reduction in support tickets related to integrations
- Development of direct measurement: Implement tracking what percent of customers setup 1+ of our integrations
- Long-term goal: Quantify how much time teams save by integrating our product with their other tools
Moving from Directional to Measurable
Here are some general tips for setting up a directional goal and moving to a measurable one.- Define success criteria - What would “better” look like, even if you can’t measure it yet?
- Identify proxy metrics - What existing data might indicate progress?
- Create measurement plan - What instrumentation needs to be built?
- Establish baseline - Once measurement is possible, what’s the starting point?
- Set targets - With a baseline established, what’s an appropriate goal?
How To Add a Near-term Strategy In Vistaly
Vistaly supports two card types for communicating a Near-term Strategy. A qualitative card type, and a quantitative card type.With Qualitative Cards That Describe The Progress You Want To Make
Qualitatitive near-term goal cards, like an Objective, help bridge the gap between long-term vision and actual execution work by describing in words the focus areas your team is pursuing in the current time period (typically quarterly or bi-annually). Popular Terms:- Objective (Default in Vistaly)
- Initiative
- Narrative
- Strategy
Depending on the questions answered during onboarding, qualitative goal cards may be disabled by default. You can enabled them at any time in Card Settings.
- Specific Challenge Diagnosis: Understanding of the specific challenge at hand and a compelling “why” teams can rally around.
- Clear Directional Approach: Establishes boundaries for acceptable solutions and builds on existing organizational strengths.
- Focused Action Areas: Concentrates resources where they’ll have maximum impact
Example
Compare these examples while referencing the considerations above. Weak ObjectiveEnhance our customer experience platform to drive growth and satisfactionStrong Objective
Challenge: Mid-market SaaS customers experience a 32% drop-off during onboarding due to integration complexity, which competitors are exploiting with simpler alternatives. Approach: Design an onboarding flow with a “15-minute to value” guarantee, simplifying the user interface while leveraging our advanced configuration engine.
With Quantitative Cards That Measure If You’re Making Progress
Outcome (or “Goal”) cards measure success for specific objectives within a defined timeframe. They have clear start and end dates with target values to achieve.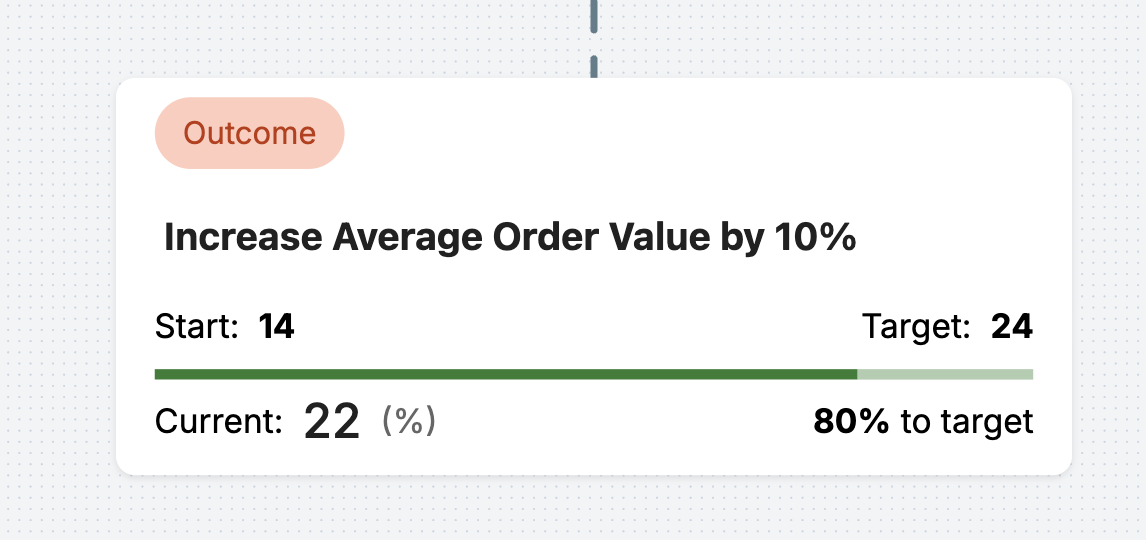
- Outcome (Vistaly Default)
- Key Result
- Goal
- Rock
4. A Shared Workspace For That Connects The Dots
A single workspace (one that visually connects your business KPIs and product metrics) is transformative, and supports your teams when solving a few key challenges:- Clarity for the Board and Execs: Leadership wants to see exactly how you plan to move top-level metrics like ARR, net retention, or gross margin. By presenting a Value Exchange Model, they can see that you’re not just delivering outputs at random, but methodically pulling the known product levers that drive business impact.
- Direction for Product Squads: Meanwhile, product teams need tangible guidance on which metrics around user value—things like onboarding success or deeper product usage—will actually push those business KPIs up? By focusing on leading indicators that reflect how easily customers can access the product’s value, squads know where to concentrate their effort and can measure progress more quickly than waiting for quarter-end revenue reports.
- A Shared Language for Alignment: Without a unifying framework, you’ll spend too much time reconciling top-down demands (“We need another $5M in ARR this quarter!”) against bottom-up realities (“Our product usage data shows we must improve repeat engagement to reduce churn”). A shared workspace that explicitly links business metrics to user-value metrics helps everyone see how product improvements lead up to broader revenue goals.
- A Living Document: Planning cycles shouldn’t take weeks (or longer!) When your medium for communicating strategy and progress is a one-off slide deck, never to be used again, you have to start from scratch every time. You need a workspace that already has up-to-date data for this strategic context so you can spend less time debating where to apply focus, and more time actually doing the work.

