Creating Reports
Vistaly’s outcome-oriented reports support creating executive or team-level reports for showing progess. Add KPI and Outcome cards from any workspace and see how shipped product improvements influence the metrics and goals that matter.Adding a New Report
- Click the Add new report button
- Enter a name for your report
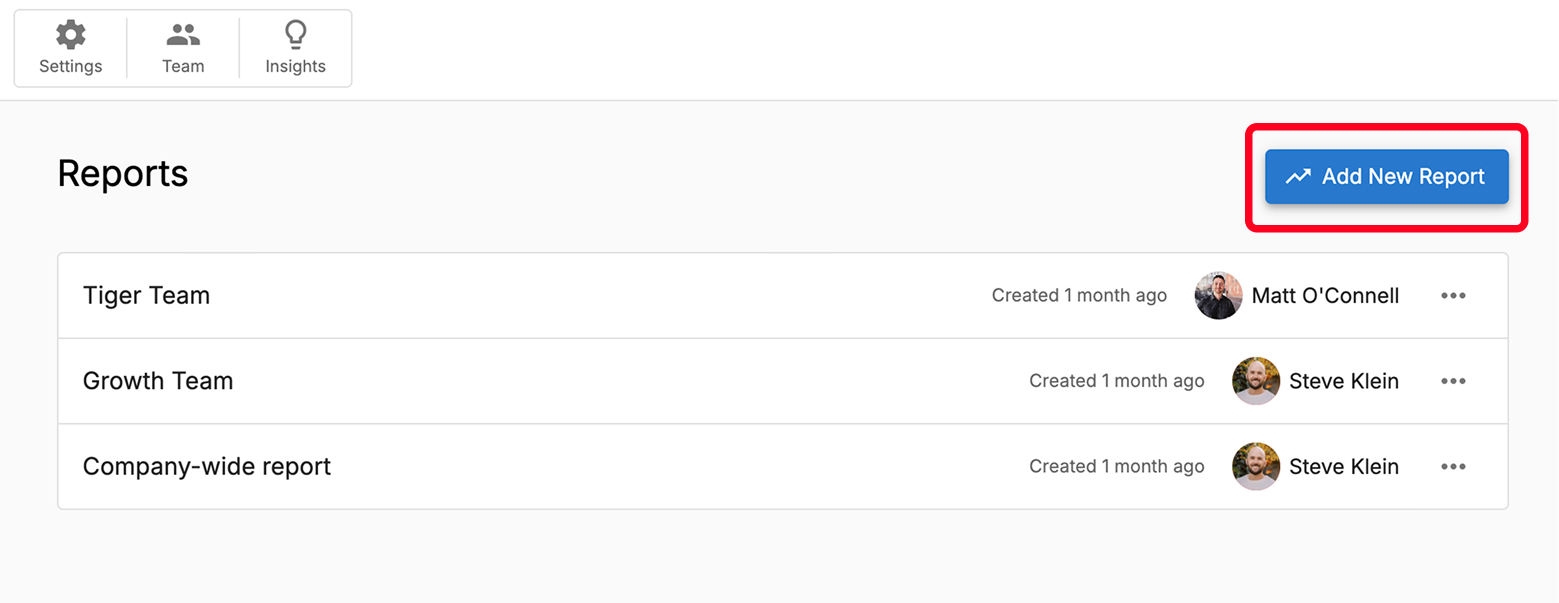
- Team-level reports: Focus on individual trios or squads
- Company-level reports: Track progress across multiple trios or squads
Working with KPIs (Perisistant)
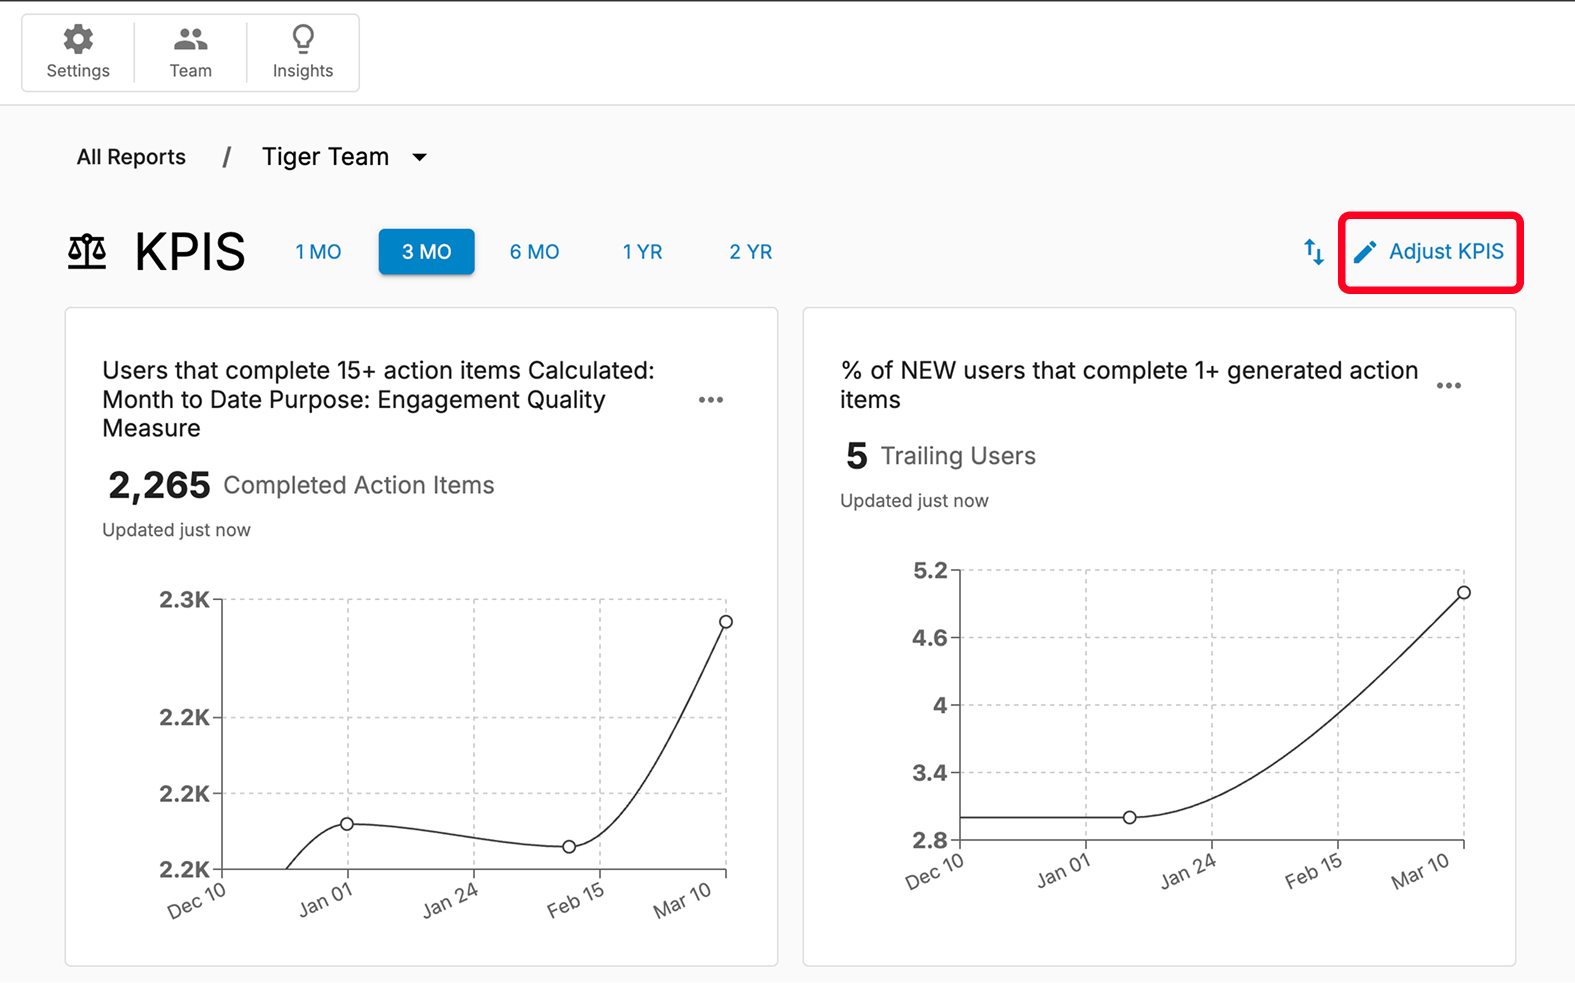
The top section of your report displays metrics. These can be (but are not limited to):- Business-level “board metrics” for company reports
- Key engagement metrics for team-level reports
- Click Adjust KPIs
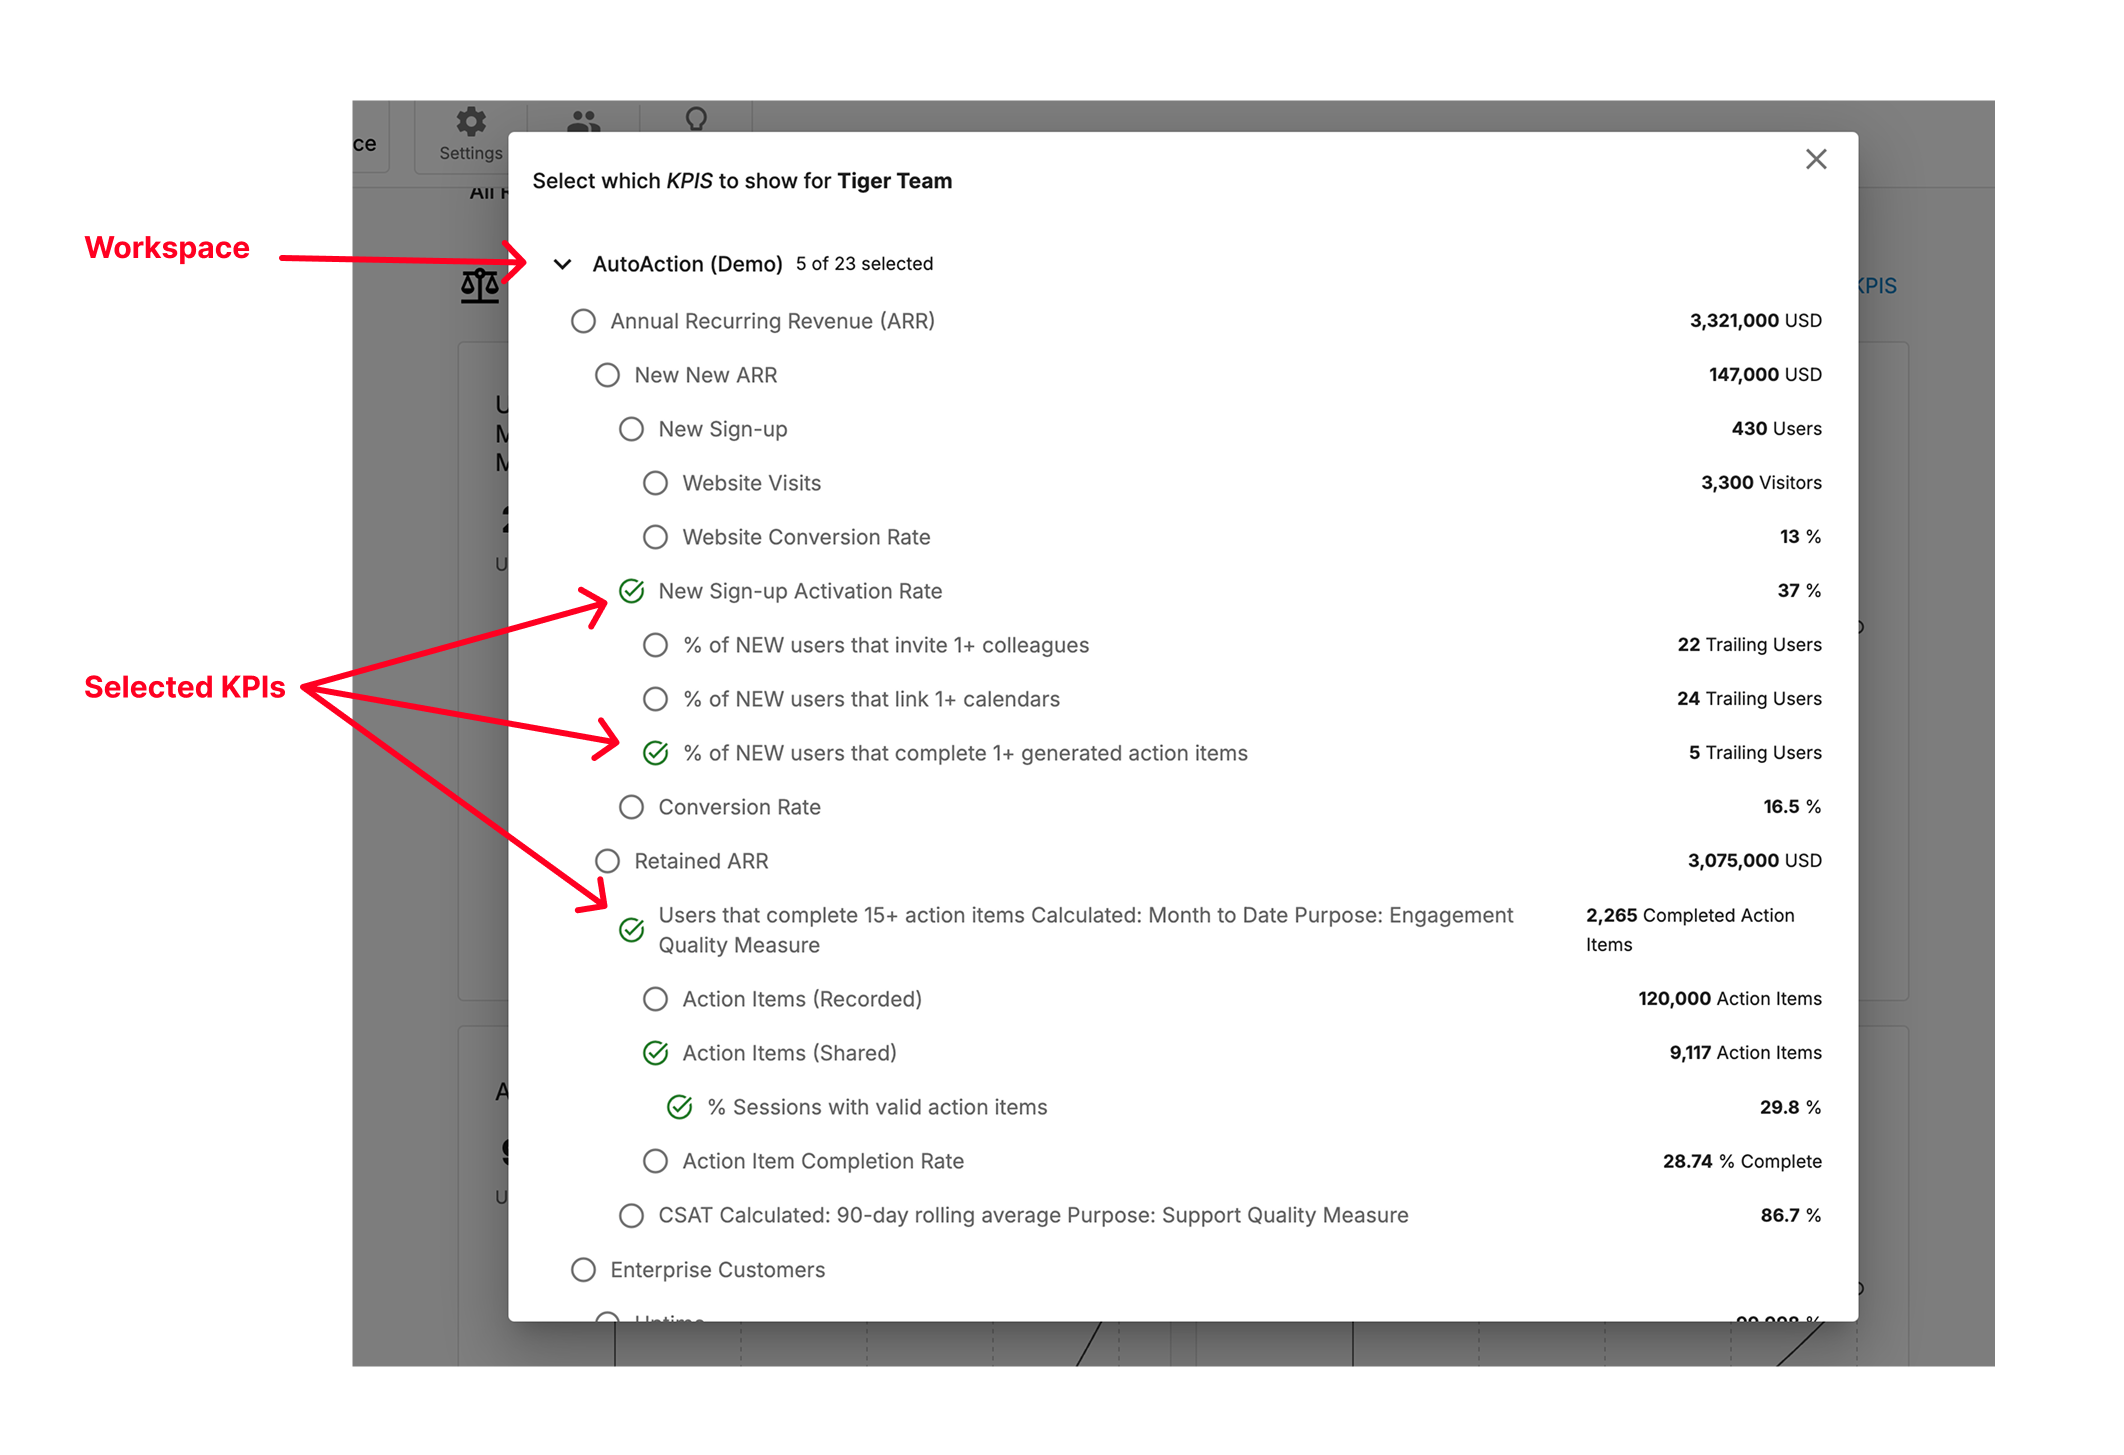
- Select one or more metrics from any workspace
- Reports exist across all workspaces, allowing you to combine KPIs from different areas of the business
- Use the sort feature to customize the order of displayed KPIs
Working with Outcomes (Time-bound)
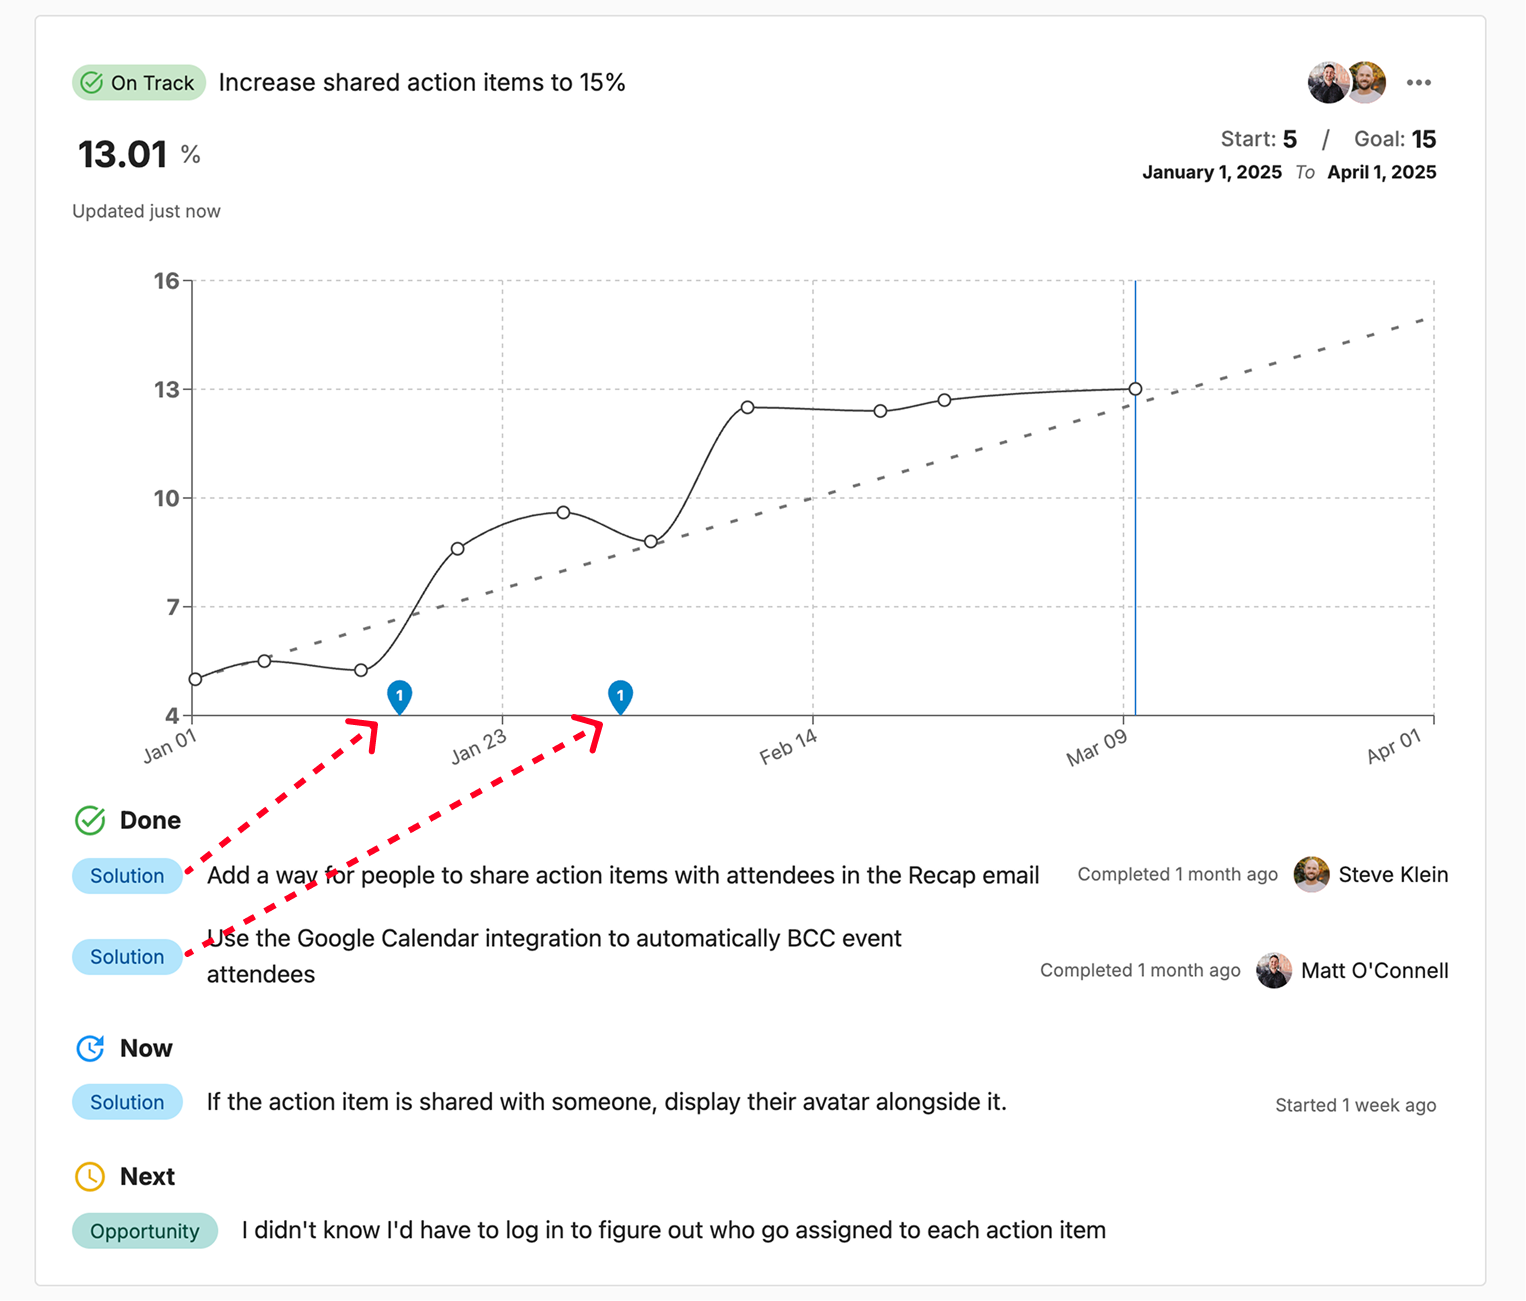
The bottom section of your report showcases outcomes:- Click Adjust Outcomes
- Select one or more outcomes from any workspace
- Displays related opportunities and solutions
- Groups items by Now, Next, Later, and Done categories
- Shows solution completion points on the timeline with pins
Customization and Editing
Timeline Planning:- Set future end dates for solutions to display projected completion points
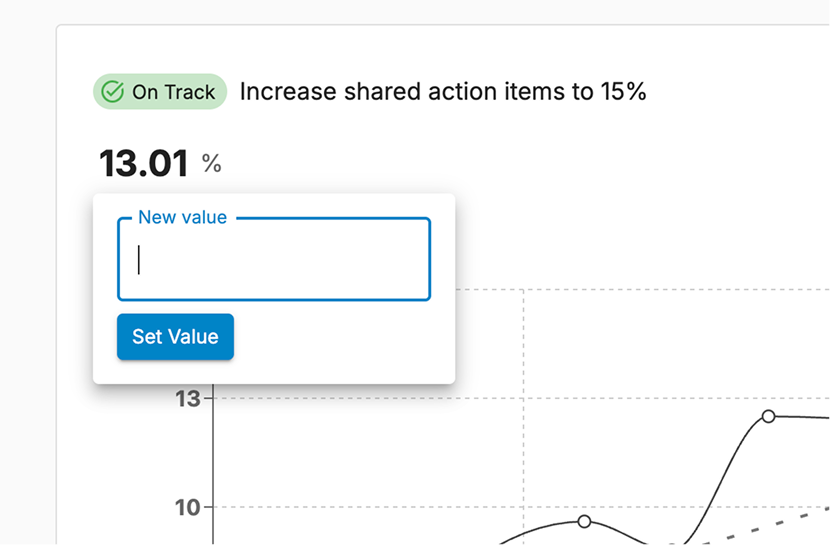
- Hover over any value to make quick changes directly in the report view
- Dates, values, and units can all be modified inline
